How pervasive is U.S. gun violence? New technology provides clues
Published 2:00 pm Sunday, April 24, 2016
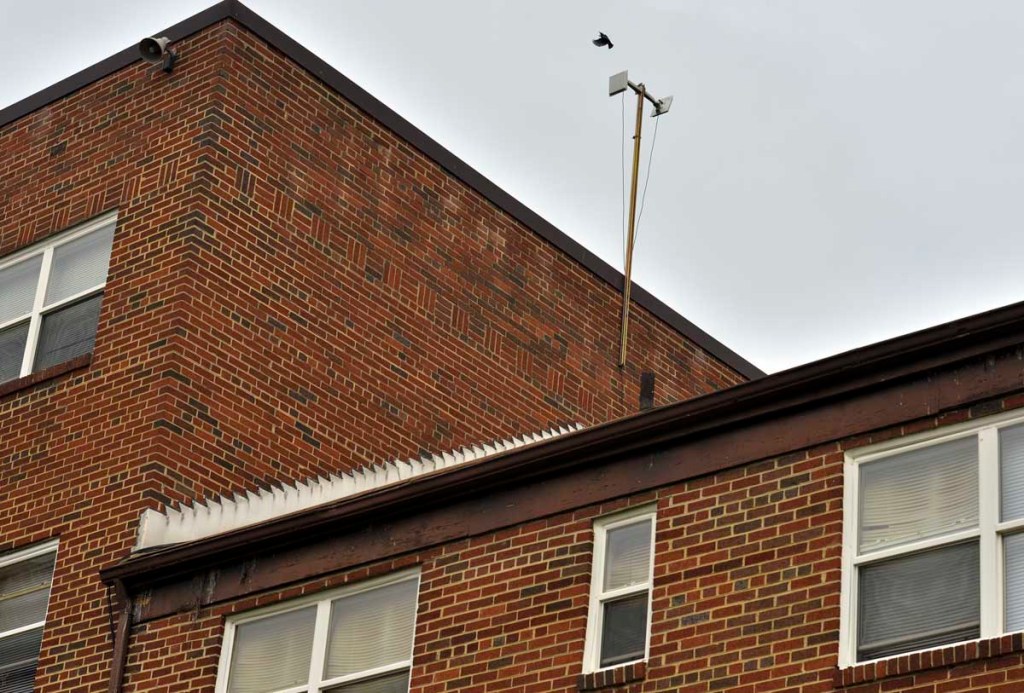
- A bird flies from its perch near ShotSpotter technology attached to a building in the District of Columbia.
In Canton, Ohio, one of the most common complaints that Police Chief Bruce Lawver hears is about gunfire. Shots fired. That unnerving pop of a firearm being discharged.
Last year, at least 772 bullets were fired in one tiny part of Canton, a city of 73,000 people. That is more than two bullets every day.
Yet, either by luck or intent, relatively few of these projectiles hit anyone. Gunfire across the entire city of Canton resulted in eight homicides, 11 suicides and 25 non-fatal injuries in 2015, according to police statistics.
This is how gun violence is usually measured – in the cold calculation of deaths and injuries.
But that familiar yardstick misses a lot.
It does not account for all the times when a gun is fired in anger, fear or by accident and the bullet simply misses its mark. Yet whether a bullet kills or injures someone is an almost random outcome from a violent act. It is influenced by the shooter’s aim, if the bullet happens to strike vital organs and even how far a victim must travel to reach a hospital trauma center.
“It’s just not the whole picture,” said Jennifer Doleac, an assistant professor of public policy at the University of Virginia, who studies the connection between gunfire and crime. “There’s a lot more gun violence than what is reflected in homicide rates.”
The more telling number about gun violence might be “shots fired.” And now, thanks to broader adoption of new technologies, it is getting easier to show just how common gun violence is in the United States.
Last year, there were 165,531 separate gunshots recorded in 62 different urban municipalities nationwide, including places such as San Francisco, Washington, District of Columbia, St. Louis and Canton, according to ShotSpotter, the company behind a technology that listens for gunfire’s acoustic signature and reports it to authorities.
Even that eye-popping number captures only a small fraction of the bullets fired each year. It does not include data from rural areas or the nation’s two largest cities – Los Angeles does not use ShotSpotter, and New York City was excluded from the 2015 tally because it did not start until mid-year.
The ShotSpotter system also covers just a sliver of each city that it is in, usually higher-crime neighborhoods. ShotSpotter’s total coverage was 173 square miles last year. And the devices tend to not hear gunshots fired indoors.
Still, the data begins to provide a fuller picture of the nation’s rampant gunfire.
Last year, those 165,531 gunshots were divided among 54,699 different incidents – an average of 150 gunfire incidents every day.
The busiest month for gunfire was May.
The busiest day was Dec. 25, Christmas.
And if you want to avoid getting shot, it is best to lie low from 2 a.m. to 3 a.m. on Saturdays. That was the busiest hour of the week for gunfire. The slowest hour was 8 a.m. to 9 a.m. on Mondays.
In Canton, where the ShotSpotter system covers about 10 percent of the city, Lawver said it has proved to be an effective crime-fighting tool. Each gunshot shows up as a red dot on a computer map in police cruisers and at police dispatch.
“We’ve found that if you follow the dot, it turns out to be very accurate,” the police chief said.
The gunman might be gone. But police can still collect shell casings and use that evidence to trace a weapon, Lawver said. A pattern develops. And repeated ShotSpotter reports – even without a victim – can lead to increased patrols to try to deter further criminal activity. Lawver said that Canton saw a 20 percent decline in gunfire incidents from 2014 to 2015.
“It does change the game when it comes to gunfire,” he said.
The ShotSpotter system works by triangulating sound picked up by sensors placed on utility poles, light posts and buildings. The widespread use of what amounts to microphones in public has been criticized for privacy concerns. But supporters say the system is focused on reducing gun violence.
Nationwide, the number of gunfire incidents fell in 2015, compared with 2014, according to ShotSpotter data. The median reduction was nearly 13 percent in the 46 cities that used the system for comparable periods. These limitations make it difficult for comparisons with other statistics, such as the Gun Violence Archive, which relies on media reports of shootings and found that the number of shooting incidents grew by 2.6 percent last year to 53,195.
But researchers have begun to discover the value in this wealth of data on gunfire.
Doleac, at the University of Virginia, and Purdue professor Jillian Carr used ShotSpotter data for Washington to determine how the city’s juvenile curfew affected gun violence.
The ShotSpotter devices were rolled out first in Anacostia in 2006, then Southeast and Northeast neighborhoods, and finally north of downtown. The researchers examined gunshots detected from 2006 to 2013.
What they found was surprising: The city’s curfew actually increased the number of gunfire incidents by 150 percent in the hour immediately after it went into effect.
The researchers focused on the one-hour period when the city’s curfew changed each year, going from midnight every night in July and August to 11 p.m. on weeknights the rest of the year.
During that hour switch-over, they found, gunfire spiked. The researchers theorized that this was because law-abiding juveniles were most likely to follow the curfew. They got off the streets. That resulted in fewer innocent witnesses or bystanders in public, potentially leading to more lawlessness and gunfire.
In another study, Doleac and Carr found that ShotSpotter data showed evidence of “severe underreporting” of gun violence when compared with the traditional metrics of homicides or 911 calls.
In Washington, 1 in 8 gunfire incidents led to a 911 call for “shots fired” in the covered areas.
“It’s clear most people don’t bother to call 911,” Doleac said.
In Washington, there was one reported homicide for every 181 gunfire incidents.
In Oakland, California, the other city that researchers studied, it was one homicide for every 62 gunshot incidents.
They noted with interest that it appears Oakland’s gunfire was at least twice as deadly as Washington’s gunfire. Although the researchers could not come up with the reasons behind this difference (Were Washington’s shooters poor shots? Did victims in Oakland get to the hospital more slowly?), the difference points to how measuring gun violence with homicides is problematic.
The Urban Institute looked at gunfire near Washington schools during the 2011-2012 school year. The policy think tank found four schools faced a disproportionate share of shots fired nearby, with nine to 11 each, and called for more study of how gun violence affects students.
Doleac said she looked forward to wider adoption of gunshot detection systems.
“We need more data like this,” Doleac said. “It allows for a much better understanding of gun violence.”